NDU Graduation Rates by College and Program
| College |
Program |
AY2015-16 |
AY2016-17 |
AY2017-18 |
AY2018-19 |
AY2019-20 |
AY2020-21 |
AY2021-22 |
AY2022-23 |
| Master's Degrees |
|
|
|
|
|
|
|
|
|
| College of Information and Cyberspace |
M.S. in Government Information Leadership |
100.00% |
100.00% |
100.00% |
100.00% |
100.00% |
100.00% |
95.92% |
100.00% |
| College of International Security Affairs |
M.A. in Strategic Security Studies |
96.67% |
97.98% |
97.67% |
100.00% |
98.48% |
100.00% |
100.00% |
98.53% |
| Eisenhower School |
M.S. in National Resource Strategy |
99.68% |
99.00% |
99.33% |
100.00% |
99.66% |
99.64% |
99.98% |
99.65% |
| Joint Forces Staff College |
M.S. in Joint Campaign Planning and Strategy |
94.74% |
97.22% |
92.31% |
97.37% |
100.00% |
95.55% |
95.56% |
100.00% |
| National War College |
M.S. in National Security Strategy |
99.52% |
99.03% |
99.51% |
99.02% |
100.00% |
99.04% |
98.57% |
100.00% |
| Graduate Certificates |
|
|
|
|
|
|
|
|
|
| Joint Forces Staff College |
Joint and Combined Warfighting |
100.00% |
100.00% |
99.52% |
99.52% |
99.46% |
99.59% |
100.00% |
99.48% |
|
Joint Forces Staff College
|
Joint and Combined Warfighting (Hybrid)
|
100.00%
|
99.60%
|
97.75%
|
94.31%
|
85.37%
|
89.67%
|
87.43%
|
87.39%
|
NDU Institutional Learning Outcomes (ILOs)
NDU’s ILOs for academic year 2023-24 are:
- ILO 1: Foster collaborative relationships across joint, interagency, international, and cultural boundaries.
- ILO 2: Demonstrate critical and creative thinking in support of national security decision-making.
- ILO 3: Create strategy and policy options in support of national security interests.
- ILO 4: Communicate effectively to provide clear and concise military and policy recommendations.
- ILO 5: Apply principles governing the profession of arms, civil-military relations, and ethics to support strategic level decision-making. (New ILO for AY24)
NDU ILOs are assessed through Program Learning Outcomes (PLOs) attainment, based on strong mapping and nesting of learning outcomes. Table 1 shows the mapping of PLOs to NDU ILOs from academic year 2022-23. Table 2 presents aggregated assessment results in the master’s programs for academic year 2022-23.
Table 1: NDU Institutional Learning Outcomes Nesting to Program Learning Outcomes (PLOs) for academic year 2022-23.
|
|
NDU ILOs
|
|
|
1. Foster collaborative relationships across joint, interagency, international, and cultural boundaries.
|
2. Demonstrate critical and creative thinking in support of national security decision-making.
|
3. Create strategy and policy options in support of national security interests.
|
4. Communicate effectively to provide clear and concise military and policy recommendations.
|
|
CIC PLOs
|
PLO 1 SLO 2: Analyze how the informational instrument of national power can be best integrated with the other instruments to achieve strategic objectives in the national security environment.
PLO 2 SLO 3: Formulate strategies, policies, and advice that support effective interagency collaboration, private- public coordination, and international cooperation.
|
PLO 4: Apply principles of strategic leadership to include effective communication, creative and critical thinking, decision making, and ethical conduct.
|
PLO 2 Create information and cyber policy, strategy, and campaign plan options that support joint warfighting and achieve national security objectives.
|
PLO 2 Create information and cyber policy, strategy, and campaign plan options that support joint warfighting and achieve national security objectives.
|
|
CISA PLOs
|
PLO 4: Lead global teams with a range of partners as part of joint, interagency, multinational and/or international cooperative security efforts.
|
PLO 1: Evaluate irregular warfare strategies within the contemporary international security environment.
PLO 3: Apply critical thinking skills to anticipate emerging threats, evolving challenges, and strategic opportunities.
|
PLO 2: Create joint warfighting strategies and policies for addressing contemporary irregular security challenges.
|
PLO 2: Create joint warfighting strategies and policies for addressing contemporary irregular security challenges.
|
|
ES PLOs
|
PLO 1c: Apply effective communication (oral) of strategic concepts and ideas across joint, interagency, multinational and industrial base environments.
PLO 2a: Apply principles governing the profession of arms to support strategic level decision-making.
PLO 2b: Apply principles governing civil-military relations to support strategic level decision-making.
PLO 2c: Apply principles governing ethics to support strategic level decision-making.
|
PLO 1a: Apply critical and creative thinking to support strategic level decision-making across joint, interagency, multinational and industrial base environments.
|
PLO 6a: Develop policy options in support of evaluating resources to achieve national security objectives.
PLO 6b: Develop policy options in support of marshaling resources to achieve national security objectives.
PLO 6c: Develop policy options in support of managing resources to achieve national security objectives.
|
PLO 1b: Apply effective communication (written) of strategic concepts and ideas across joint, interagency, multinational and industrial base environments.
PLO 1c: Apply effective communication (oral) of strategic concepts and ideas across joint, interagency, multinational and industrial base environments.
|
|
JAWS PLOs
|
PLO 5: The graduate can analyze strategic situations and identify the challenges and opportunities facing strategic leaders, while providing appropriate guidance and recommendations based on an appreciation of the nature of the joint, interagency, intergovernmental, and multinational environment.
PLO 6: The graduate can model ethical and moral principles of strategic leadership and decision-making while advising superiors and mentoring subordinates.
|
PLO 3: The graduate can, as a leader and a team member, employ joint planning and processes in the development of campaign, contingency, and crisis plans, or strategies.
PLO 4: The graduate can employ current concepts in planning, while also recognizing changing future environments, domains, and emerging technologies and modifying responses appropriately.
PLO 5: The graduate can analyze strategic situations and identify the challenges and opportunities facing strategic leaders, while providing appropriate guidance and recommendations based on an appreciation of the nature of the joint, interagency, intergovernmental, and multinational environment.
PLO 6: The graduate can model ethical and moral principles of strategic leadership and decision-making while advising superiors and mentoring subordinates.
|
PLO 3: The graduate can, as a leader and a team member, employ joint planning and processes in the development of campaign, contingency, and crisis plans, or strategies.
PLO 1: The graduate can describe situations and identify challenges and problems relating to Great Power Competition and the global strategic environment, to include actors and environmental conditions, and the role of the military in relation to the other elements of national power and other actors.
PLO 5: The graduate can analyze strategic situations and identify the challenges and opportunities facing strategic leaders, while providing appropriate guidance and recommendations based on an appreciation of the nature of the joint, interagency, intergovernmental, and multinational environment.
PLO 2: The graduate can produce a military strategy at all levels, working within current DoD systems, while also analyzing and contributing to national strategies at all levels.
PLO 1: The graduate can describe situations and identify challenges and problems relating to Great Power Competition and the global strategic environment, to include actors and environmental conditions, and the role of the military in relation to the other elements of national power and other actors.
|
|
|
NWC PLOs
|
SLO 4a: Foster collaborative relationships across joint, interagency, international, and cultural boundaries.
|
SLO 4c: Demonstrate critical and creative thinking in support of national security decision-making.
|
PLO 5: Conceptualize and develop national strategies, revise existing strategies, and understand how strategies evolve and are implemented to viably address national security challenges.
|
SLO 4d: Communicate effectively [written & oral] to provide clear and concise military and policy recommendations.
|
Table 2: Targets and Levels of Achievement of ILOs as Measured by PLO Key Assessments
|
|
|
NDU ILO
|
|
|
|
1
|
2
|
3
|
4
|
|
CIC
|
ILO Targets
|
90%
|
90%
|
90%
|
90%
|
|
ILO Achievement
|
95%
|
92%
|
95%
|
92%
|
|
CISA
|
ILO Targets
|
90% earn 83% (B) or higher
|
90% earn 83% (B) or higher
|
90% earn 83% (B) or higher
|
90% earn 83% (B) or higher
|
|
ILO Achievement
|
100%
|
100%
|
100%
|
100%
|
|
ES
|
ILO Targets
|
85%
|
85%
|
85%
|
85%
|
|
ILO Achievement
|
98.7%
|
97.9%
|
96.7%
|
98.9%
|
|
JAWS
|
ILO Targets
|
85%
|
85%
|
85%
|
85%
|
|
ILO Achievement
|
85%
|
85%
|
86%
|
87%
|
|
NWC
|
ILO Targets
|
95% earn a “pass” grade.
|
95% earn a “meets” standard (grade of 80%) or higher
|
95% earn a “meets” standard (grade of 80%) or higher
|
95% earn a “meets” standard (grade of 80%) or higher
|
|
ILO Achievement
|
100%
|
99%
|
100%
|
100%
|
|
Overall NDU Average**
|
ILO Targets
|
100%
|
100%
|
100%
|
100%
|
|
ILO Achievement
|
96%
|
95%
|
96%
|
96%
|
**The NDU Overall Average is calculated by averaging the percentage of students who met each college standard for each key assessment.
Joint Acculturation Outcomes
One of NDU’s educational standards, as prescribed by the Chairman of the Joint Chiefs of Staff Officer Professional Military Education Policy, is to “develop joint awareness, perspective, and attitudes” (CJCSI 1800.01E). Specifically, NDU curricula prepare graduates to operate in a joint, interagency, intergovernmental, and multinational environment, reflected in the mix of students and faculty, the critical analyses of current and emerging national strategies from a joint perspective, and a commitment to joint and interagency cooperation.
The Joint Acculturation Survey is designed to measure the development of joint attitudes and perspectives, common beliefs, and trust, which occurs when diverse groups such as our student body come into continuous, direct contact. Beginning in AY 2017-2018, all NDU master’s students complete the instrument at the beginning of the academic year and again near graduation.
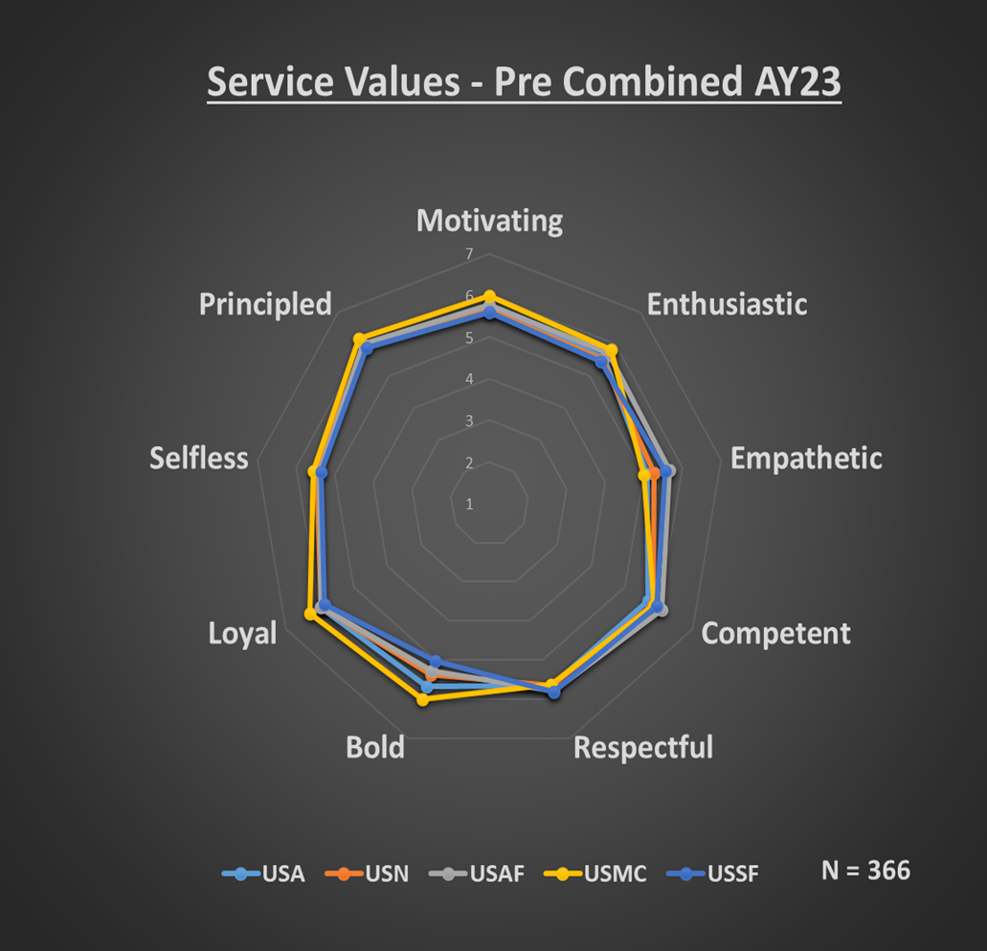
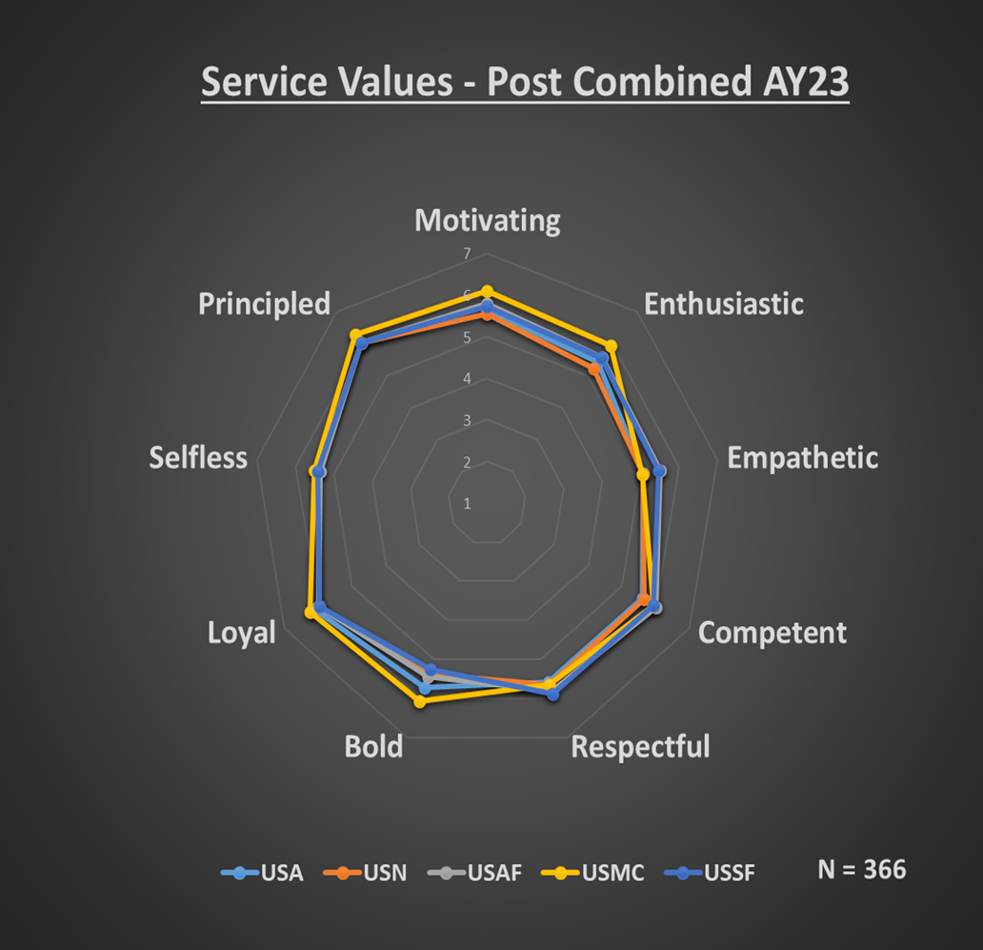
In AY 2022-2023, students reported a higher “ability to effectively contribute to a joint team” at the end of the program (Mean = 6.34, SD = 0.86) as compared to their ability at the beginning (Mean = 6.11, SD = 0.94). In addition, the following charts show that perceptions of the various US Service cultures changed over time. The charts represent scores on a nine-item semantic differential scale. Overall, at the post-test occasion, services patterns are more similar, indicating a trend towards perceiving fewer differences or more “jointness.”
|
Perceptions of US Service Cultures: Pre-test
|
|
Perceptions of US Service Cultures: Post-test
|